Description of the problem
In the lending industry, investors provide loans to borrowers in exchange for the promise of repayment with interest. If the borrower repays the loan, then the lender profits from the interest. However, if the borrower is unable to repay the loan, then the lender loses money. Therefore, lenders wants to minimize the risk of a borrower being unable to repay a loan.
In this exercise, we will use loan data from LendingClub, a website that connects borrowers and investors over the internet. The dataset is in the file Loans.csv. There are 9,578 observations, each representing a 3-year loan that was funded through the LendingClub.com platform between May 2007 and February 2010. There are 14 variables in the dataset, described in the table below. We will be trying to predict NotFullyPaid, using all of the other variables as independent variables.You can also download the dataset using this link.
Variable | Description |
CreditPolicy | 1 if the customer meets the credit underwriting criteria of LendingClub.com, and 0 otherwise. |
Purpose | The purpose of the loan ("Credit Card", "Debt Consolidation", "Educational", "Home Improvement", "Major Purchase", "Small Business", or "Other"). |
IntRate | The interest rate of the loan, as a proportion (a rate of 11% would be stored as 0.11). Note that borrowers judged by LendingClub to be more risky are assigned higher interest rates. |
Installment | The monthly installments(\$) owed by the borrower if the loan is funded. |
LogAnnualInc | The natural log of the self-reported annual income of the borrower. |
Dti | The debt-to-income ratio of the borrower(amount of debt divided by annual income). |
Fico | The FICO credit score of the borrower. paid by consumer households for goods and services. |
DaysWithCrLine | The number of days the borrower has had a credit line. |
RevolBal | The borrower's revolving balance (amount unpaid at the end of the credit card billing cycle). |
RevolUtil | The borrower's revolving line utilization rate (the amount of the credit line used relative to total credit available). |
InqLast6mths | The borrower's number of inquiries if the loan was not paid back in full, and 0 otherwise. by creditors in the last 6 months. |
Delinq2yrs | The number of times the borrower had been 30+ days past due on a payment in the past 2 years. |
PubRec | The borrower's number of derogatory public records (bankruptcy fillings, tax liens, or judgments). |
NotFullyPaid | 1 if the loan was not paid back in full, and 0 otherwise. |
What you will build
- Logistic regression model
What you will learn
- Explore the dataset by using pandas, numpy, matplotlib.
- Use over-sampling and normalization to preprocess the data.
- Use logistic regression classifier to predict whether a loan will be fully paid back.
- Use confusion_matrix and ROC curve to evaluate model performance.
- Analyze an investment strategy based on prediction model.
- pandas
- numpy
- matplotlib
- sklearn
- seaborn
- math
- imblearn
First, use pandas pd.read_csv to read the csv file. Since the dataset doesn't have any invalid value, you can skip the step of cleaning the data.
Have a look of top 5 rows in the dataset (part of the columns):

You can also use df.info() to get to know more about the data:

Correlation matrix in for numerical features
You can use plot_corr to plot correlation map.
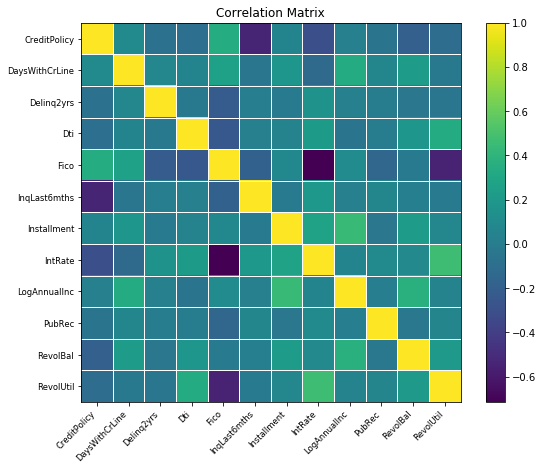
The correlation map shows:
- Fico score inversely correlates with credit line utilization and interest rate.
- Credit Policy inversely correlates with the number of inquiries by creditors.
Handling a categorical feature
"Purpose" is categorical variables, which need to be converted into dummy variables.
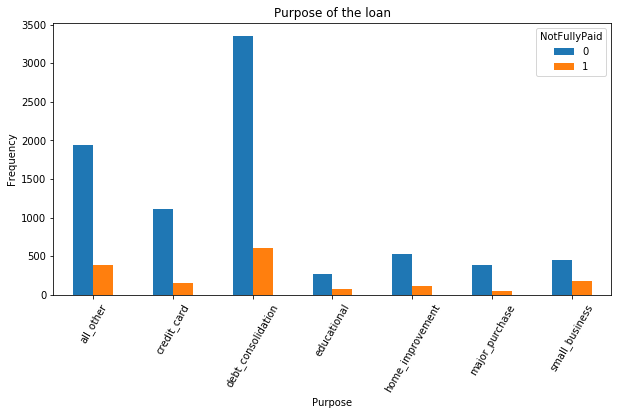
The chart above shows that most people apply for their loans for debt consolidation or for other reasons. Then you can convert categorical variable(Purpose) into dummy/indicator variables. After conversion, the variables should look like this (The below is part of the columns):

You can explore the dataset more deeply, by grouping by the target to get the mean value of each feature and learn more about the data.
You may be able to find:
- The borrowers who meet the credit underwriting criteria (CreditPolicy=1) have higher FICO credit score by 33 points compared with the counterpart.
- The borrowers with higher Interest rate of loan, installment, DIT, revolving balance, more days with credit line and higher derogatory public records have a higher risk of not fully paying back the loan.
- If the borrowers' purpose is for small business, they have a higher risk of not paying back the loan in full. However, if the purpose is credit card, borrowers are more likely to pay back in full.
Handling an imbalanced distribution
The distribution of the target "NotFullyPaid" is shown below:
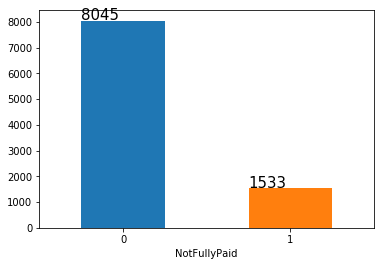
You can see that our target distribution is imbalanced. Most people have fully paid their loan (8045), while the small number of people have not fully paid back (1533). In order to gain a better performance of the model, we will apply random over-sampling method to the original training data in the following step.
Start by selecting features X and target y and scaling the X to make the variables have the same range as y. Since our target distribution is imbalanced, use over-sampling method to increase the number of instances in the minority class. Then, you can separate the dataset in the ratio of 70:30 for training and testing respectively.
The target distribution will be balance after this step:
Training set: Counter({0: 5619, 1: 5619})
Test set: Counter({0: 2426, 1: 448})
Question 1
Now, build a logistic regression model that predicts the dependent variable NotFullyPaid using all of the other variables as independent variables. Use the training set as the data for the model. Describe your resulting model. Which of the independent variables are significant in your model?
We will build a logistic regression model with Random Forest Classifier. Ensemble Learning enables you to try to make better predictions on a dataset.
First, tune model hyperparameters to get a best model. It is simple to write a function to report the result. Then, create a logistic regression model by using the best parameters.
The accuracy(test data) in the notebook is (might be different after you run your code) 0.64, where c=1.03 with L2 norm. The selected independent variables are on the jupyter notebook.
K-fold cross validation
K-fold cross validation is useful when evaluating machine learning models on a limited data sample. The dataset is divided into k subsets or folds. After cross validation, the accuracy of the model is 0.62(+/- 0.03), which is not so different from the accuracy of 0.64, meaning that the model is less likely to be overfitting.
Question 2
Consider two loan applications, which are identical other than the fact that the borrower in Application A has a FICO credit score of 700 while the borrower in Application B has a FICO credit score of 710. Let Logit(A) be the value of the linear logit function of loan A not being paid back in full, according to our logistic regression model, and define Logit(B) similarly for loan B. What is the value of Logit(A) - Logit(B)?
To keep all the features identical except the FICO credit score, you can create two test sets for A and B whose FICO are 700 and 710 relatively.
In order to get the value of Logit(A) - Logit(B), we compute

The result should be like this:
The mean value of Logit(A)-Logit(B) is: 0.023218260437692432+/-0.002056308063073425
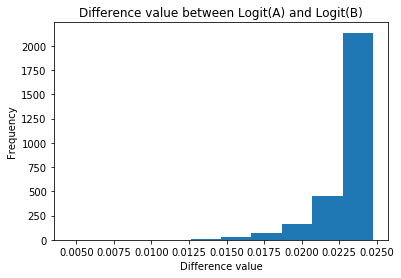
The result of Logit(A)>Logit(B) shows the borrower A is more likely to fail to fully pay back the loan than borrower B.
Question 3
What is the test set AUC of the model? Given the accuracy and the AUC of the model on the test set, do you think this model could be useful to an investor to make profitable investments?
Answer:
The AUC(Area Under the Curve) of the model is 0.62.
The accuracy of the model is 0.64.
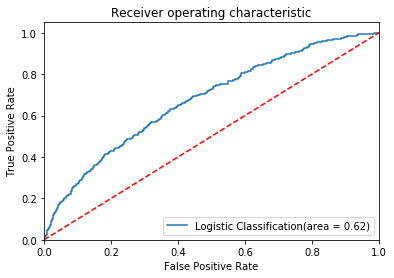
Accuracy measures the number of correct predictions out of all the predictions made, while the AUC measures the performance of a binary classifier averaged across all possible decision thresholds. Both of them have the score around 0.64, which means the model is still not good enough for investors to make profitable investments. However, compared to random guess (50/50), the logistic regression model has a better performance on the prediction.
Y_test prediction is:
[[1566, 860]
[180 , 268]]
You can also check the confusion matrix of the test set and plot a heatmap to visualize the confusion matrix.
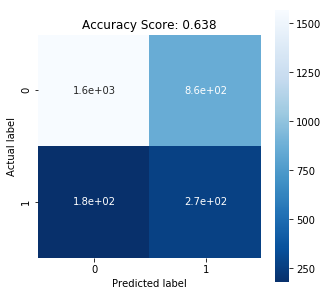
Then, print out the performance report for your model. The performance of the model is:

In the report, the recall score (=true positive/predicted results) is low, which suggests it is difficult for the model to detect the positive class (the borrowers may not fully pay back the loan).
LendingClub assigns the interest rate to a loan based on their estimate of that loan's risk. This variable, IntRate, is an independent variable in our dataset. In this part, we will investigate by using only the loan's interest rate as a "smart baseline" to order the loans according to risk.
Question 4
Using the training set, build a logistic regression model that predicts the dependent variable NotFullyPaid using IntRate as the only independent variable. Is IntRate significant in this model? Was it significant in the first logistic regression model you built? How would you explain this difference?
Answer:
The accuracy of the new model is 0.58. It decreases when using a single feature, compared with the previous logistic regression model.
Question 5
Use the model you just built (with only one independent variable) to make predictions for the observations in the test set. What is the highest predicted probability of a loan not being paid back in full on the test set? How many loans would we predict would not be paid back in full if we used a threshold of 0.5 to make predictions?
Answer:
The highest predicted probability of a loan not being paid back in full on the test set is 0.73
1265 out of 2874 loans would not be paid back in full.
The heatmap of confusion matrix and the performance report of the new model:
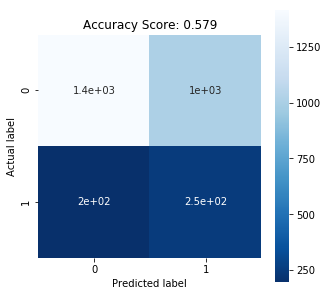

In the report, the recall score is lower than that of the model with all the independent variables (0.65), which suggests the model with the one variable is less valuable.
Question 6
Compute the test set AUC of the model. How does this compare to the model using all of the independent variables? In your opinion, which model is stronger? Why?
Answer:
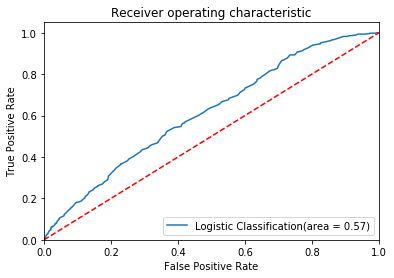
The accuracy of the model with one independent variable is 0.58 and the AUC is 0.57. The performance when using all the independent variables (accuracy is 0.65 and AUC is 0.62) is better than the performance when using only one feature.
Let us now see how our logistic regression model can be used to identify loans that are expected to be less riskier.
Question 7
If the loan is paid back in full, then the investor makes interest on the loan. However, if the loan is not paid back, the investor loses the money invested. Therefore, a conservative investor should invest in portfolio of loans with the lowest default rates. How can we select loans with lowest risk?
Answer:
We can use two simple ways to select loans with lowest risk.
- Select loans with the lowest interest rate, given higher risk higher rate. (No Model)
- Select loans with lowest predicted risk of being default
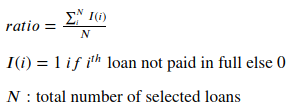
The performance of the two methods can be evaluated by the following ratio:
Question 8
How can we compare the ability to find loans with lower risk of default for interest rate selector and predicted risk selector?
Answer:
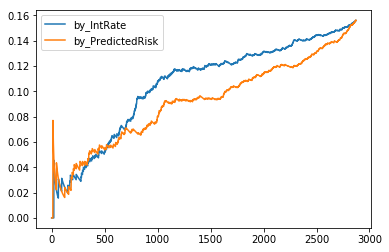
A line chart with X as the number of loans and Y as the ratio mentioned above. Line with flatter and lower values is prefered.
Question 9
What is our observations from the default rate chart above?
Answer:
- When selecting a lower number of loans, both selectors perform comparably.
- When selecting a higher number of loans, selector of PredictedRisk is able to find more loans paid in full.
And thus, it is concluded that the logistic regression model is able to help construct portfolio of loans with lower default rate.
Question 10
One of the most important assumptions of predictive modeling often does not hold in financial situations, causing predictive models to fail. What do you think this is? As an analyst, what could you do to improve the situation?
Answer:
Logistic regression assumes linearity of independent variables and log odds. Although this analysis does not require the dependent and independent variables to be related linearly, it requires that independent variables are linearly related to the log odds, or it will cause predictive models to fail.
As the result table shows, the model with feature selection yielded the best result (Accuracy score: 0.654). This analysis shows selecting meaningful independent variables is important and doing so at the very beginning can improve the model, bringing high probability for independent variables to linearly relate to the log odds.
Result table:

Bertsimas.D, O'Hair.A.K, Pulleyblank.W.R (2016) The Analytics Edge