Last Updated: 2021-07-14
What is QuSandbox?
QuSandbox is a platform that helps users deploy and audit machine learning models, experiments and results.
What you'll do
In this codelab, you're going to use the QuSandbox to review an audit example of a machine learning pipeline. Your will need to:
- Create the account (If you haven't already)
- Browse machine learning tools
- Browse the demo audit process
- Audit and generate reports
What you'll need
- A recent version of Chrome
- A working email
Steps
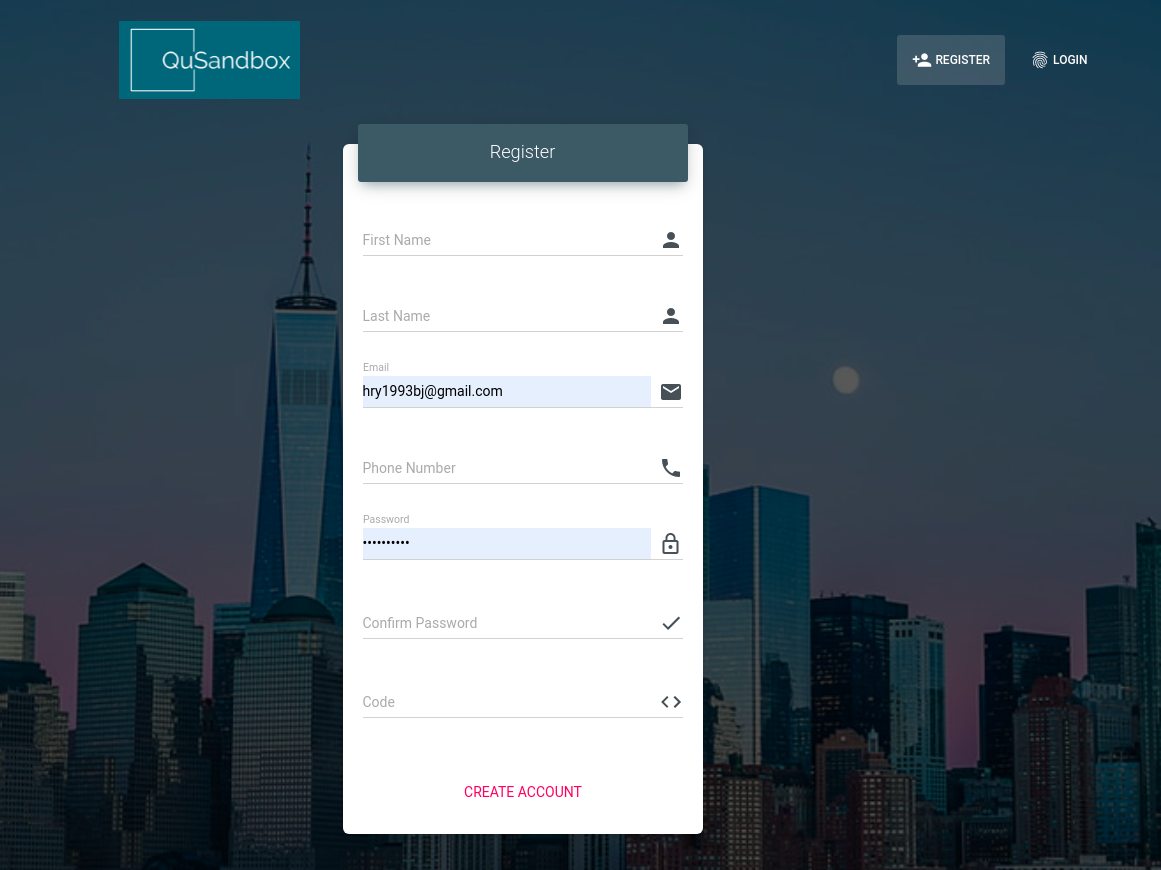
https://demo.qusandbox.com/auth/register-page, go to the register page and input your name and a valid email, with a complex enough password(contains capital character, symbol, number, and at least 8 characters long). Ask info@qusandbox.com for the registration code.
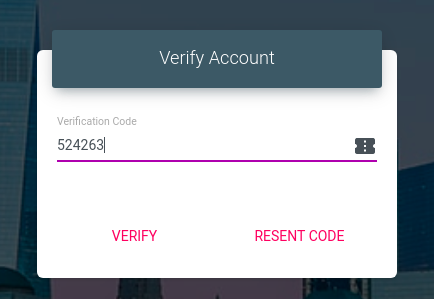
get the code from the email (If not received, please check spam, advertisement, and promotion), and input the code to activate your account.

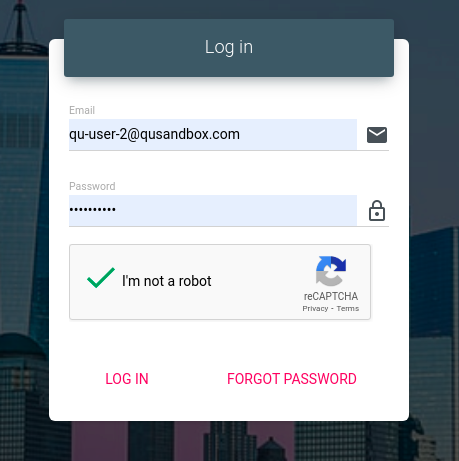
- https://demo.qusandbox.com/auth/login-page, go to the login page, input your info and pass the reCAPTCHA to login. (If you forget to activate your account, the system will ask you to redo the above step)
Steps
In the QuSandbox, every Algorithmic audit will be structured as Projects. In each project, you can have multiple experiments. Follow the instructions below to create your project.
- After login, you would be about to see a dashboard called Projects, which represents the project for which access has been provisioned.

- Click the QuProjects, you would be able to browse the projects and create new projects.
- Click on any of the demo projects shared with you. Here, you could browse and manage the experiment related to the project.
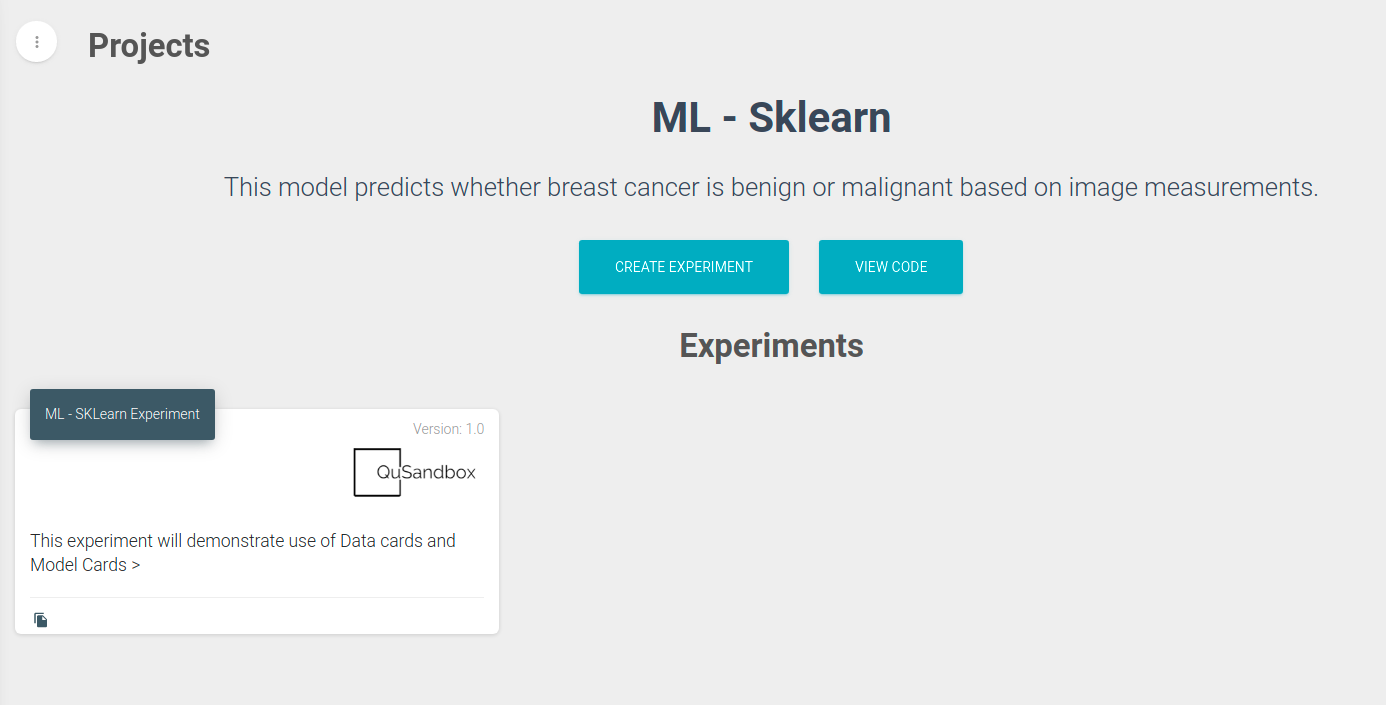
- Click the demo experiment (for example, ML - SKLearn), and browse the dashboard. This is a demo experiment and no changes can be done here. If you want to try your own experiment, clone the experiment (using the icon in the bottom left of the experiment) to try out changes
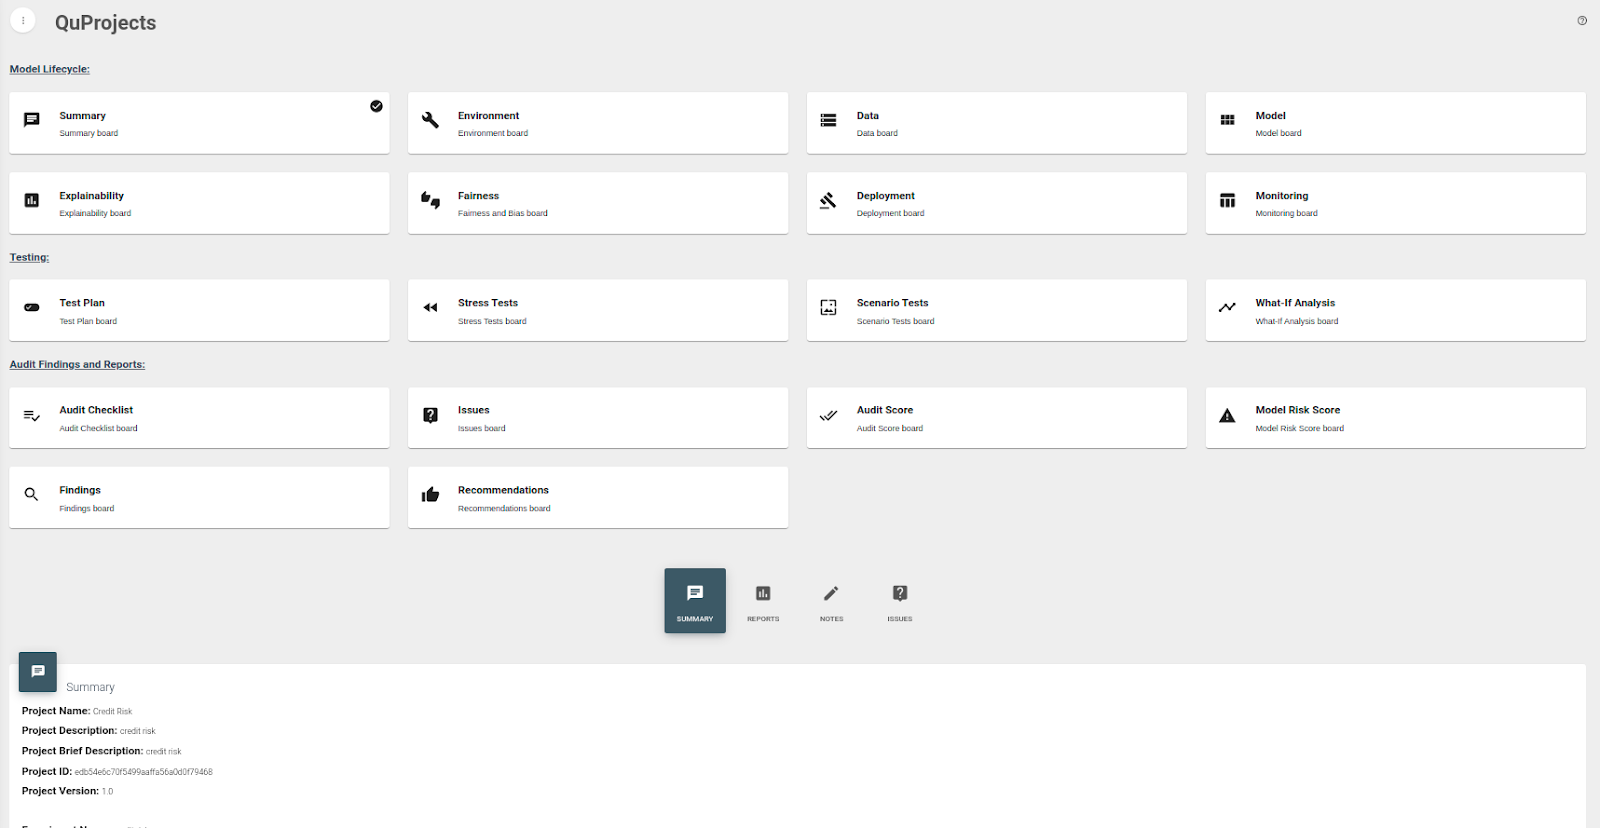
Detail
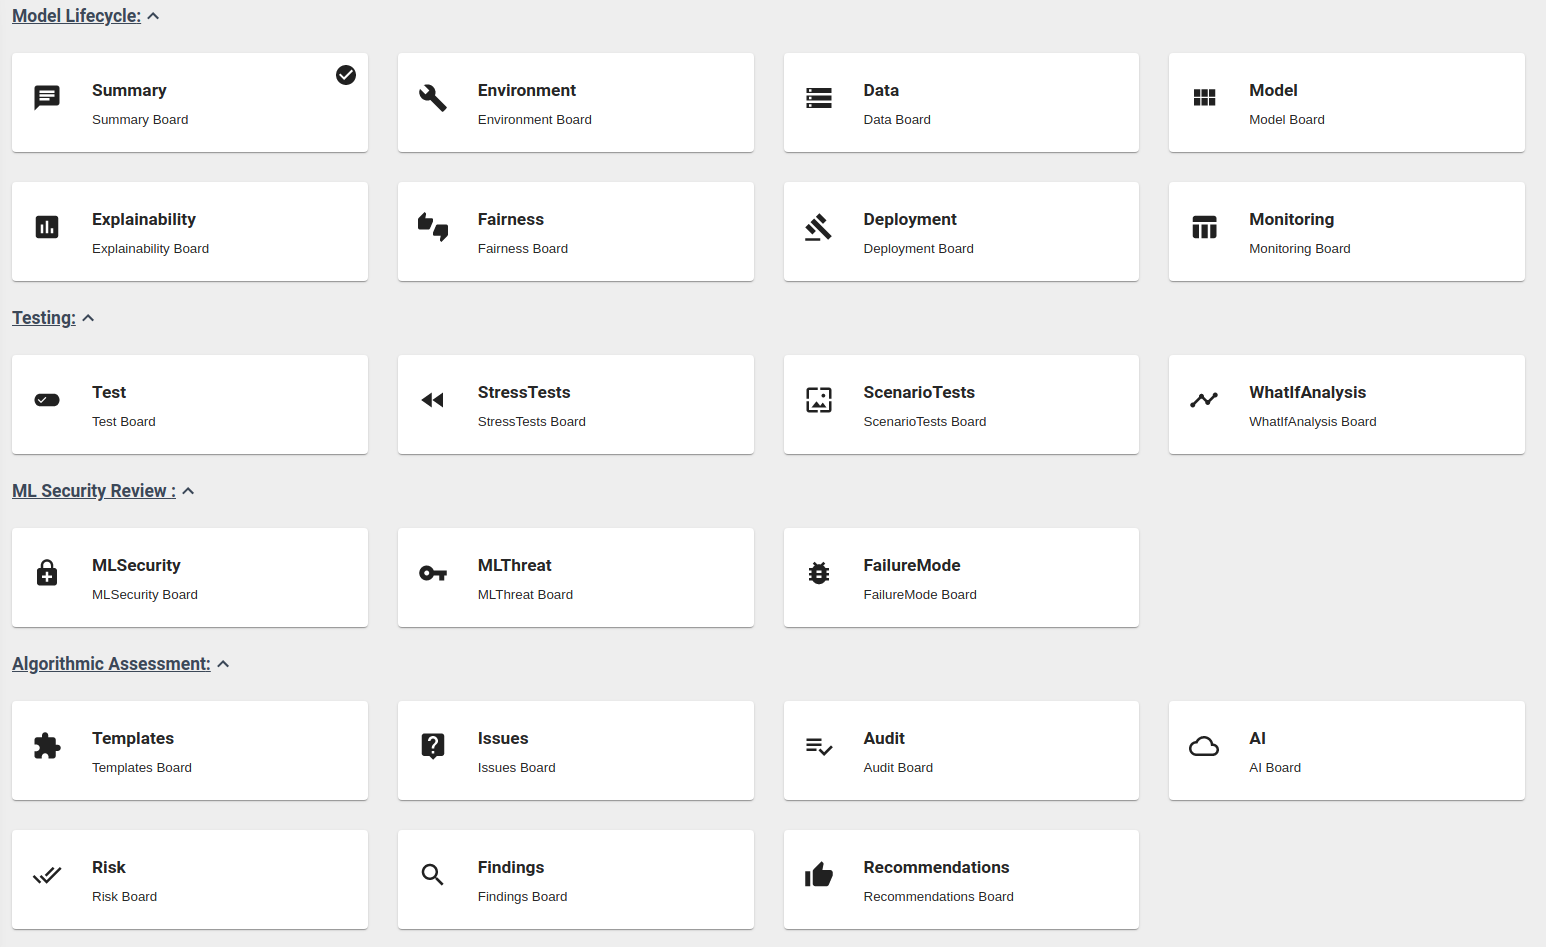
- The experiment consists of three parts, Model lifecycle, Testing, and Audit findings and reports. Each part contains several boards.
- Each board would be composed of four parts, Main content, Notes, Issues, and Reports. The Note consists of a title, text, and image to help record the process. The Issues record information about risks and ratings. The Report is about generating short reports for a specific board.
- In the Summary board, you could view the basic info about the environment and project.
- In the Environment board, you could view a pipeline description of the experiment process about how the model is generated and deployed in the pipeline sub-board. In the Model sub-board, we could post the experiment configuration JSON to Model Studio, which can automatically deploy and reproduce the whole pipeline. (Please contact us at info@qusandbox.com if you need to try out the Model Studio)
- In the Data board, you could view the data visualization report generated by Superset, and the data report generated by code, containing pandas profiling and facets.
- In the Model board, there are reports generated by a customized version of Google's Model Card Toolkit.
- In the Explainability board, you can access the Explainability tools supported by the QuSandbox
- In the Fairness board, you can access the Fairness tools supported by the QuSandbox
- In the Deployment board, you could browse demo app hosting and interpret the model. Examples for streamlit apps with an interactive UI, fastAPI under OpenAI specification are provided.
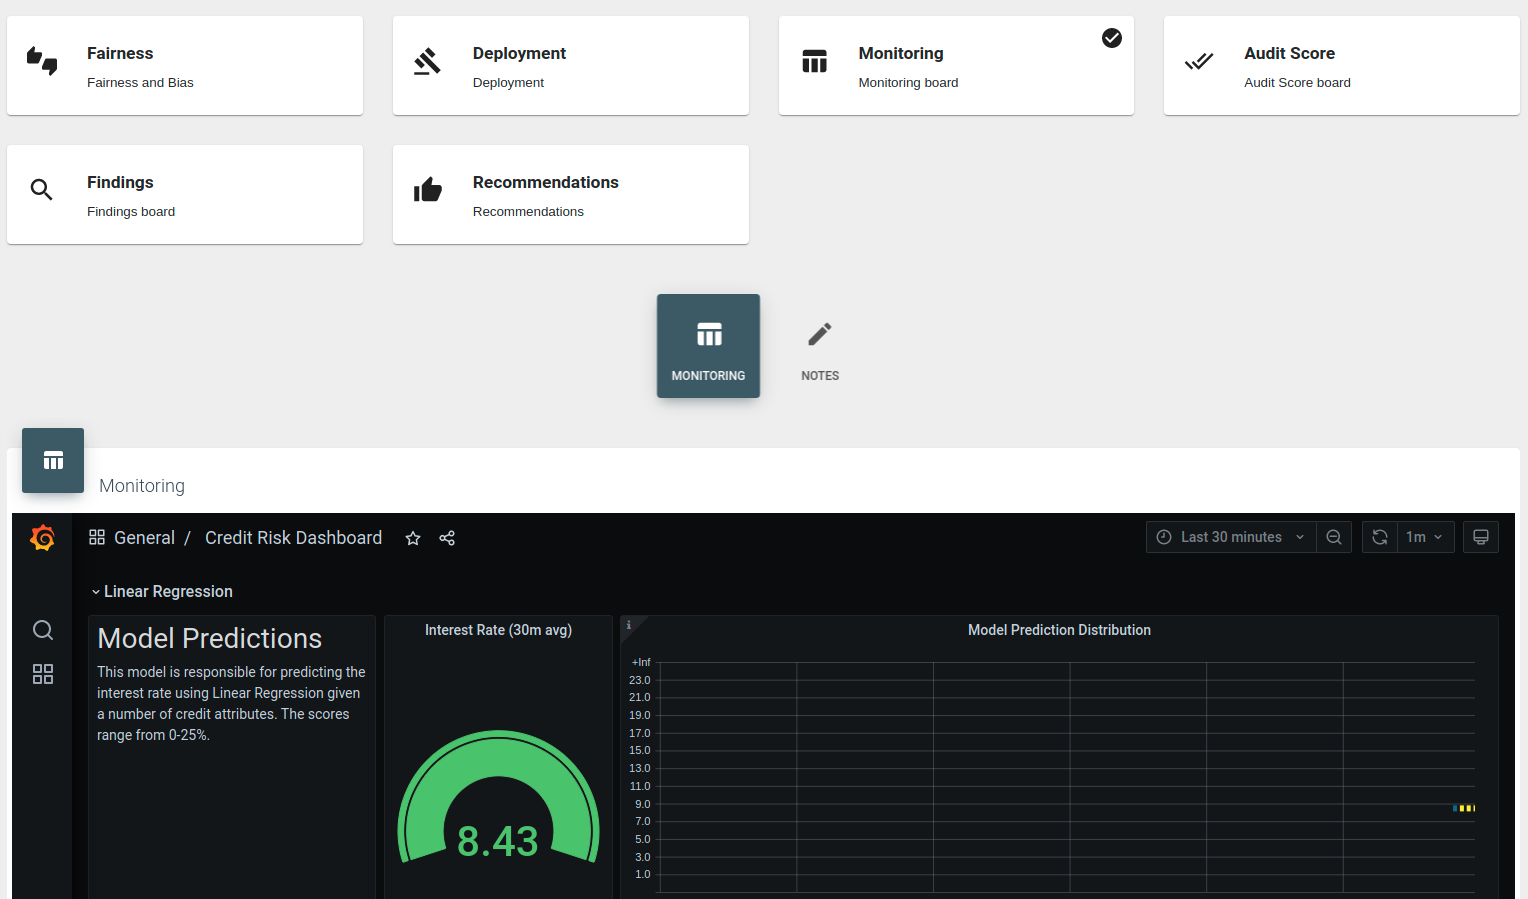
- In the Monitoring board, we use Grafana and Prometheus to generate a monitoring dashboard to monitor the model's actual performance.
- The Testing boards are currently under development (Please contact us at info@qusandbox.com for updates and to sign up for an early release)
- In the Audit Checklist board, you can also browse and edit all the pre-created reports.
- In the Issues board, you can browse all issues posted inside this experiment.
- In the Audit Score Board & Risk Score Board, we provide risk assessment templates for the user to rate the aspects of the model to generate a multi-page report that calculates and rating the model quality.
- For now, the Findings and Recommendations boards are currently under development (Please contact us at info@qusandbox.com for updates and to sign up for an early release)
Steps
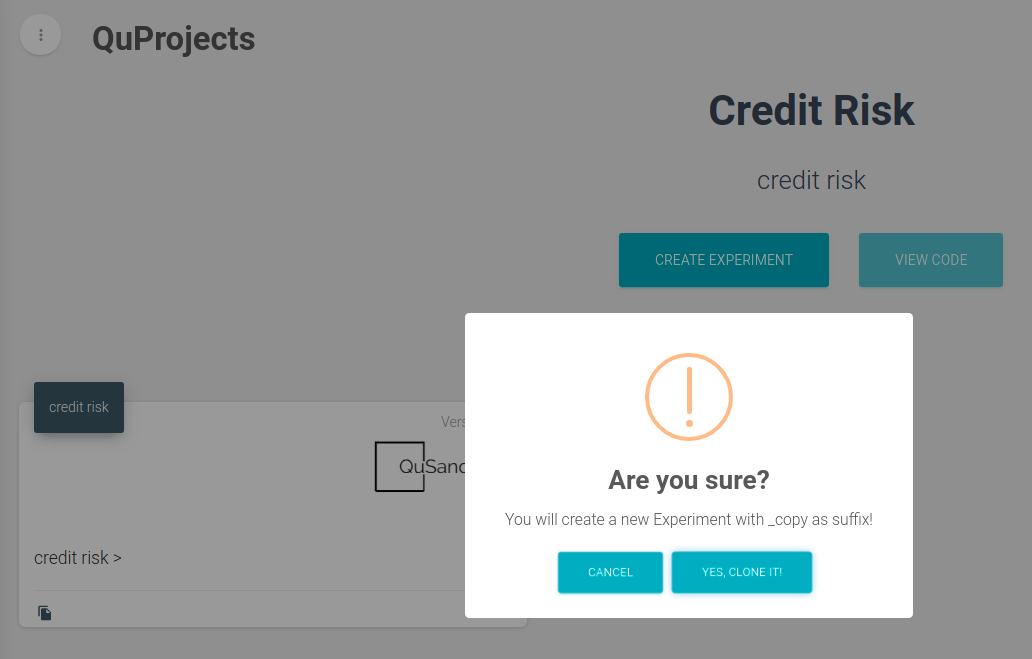
- Open the shared credit risk project, click the copy button in the left corner of the demo experiment, you would be able to clone an experiment.
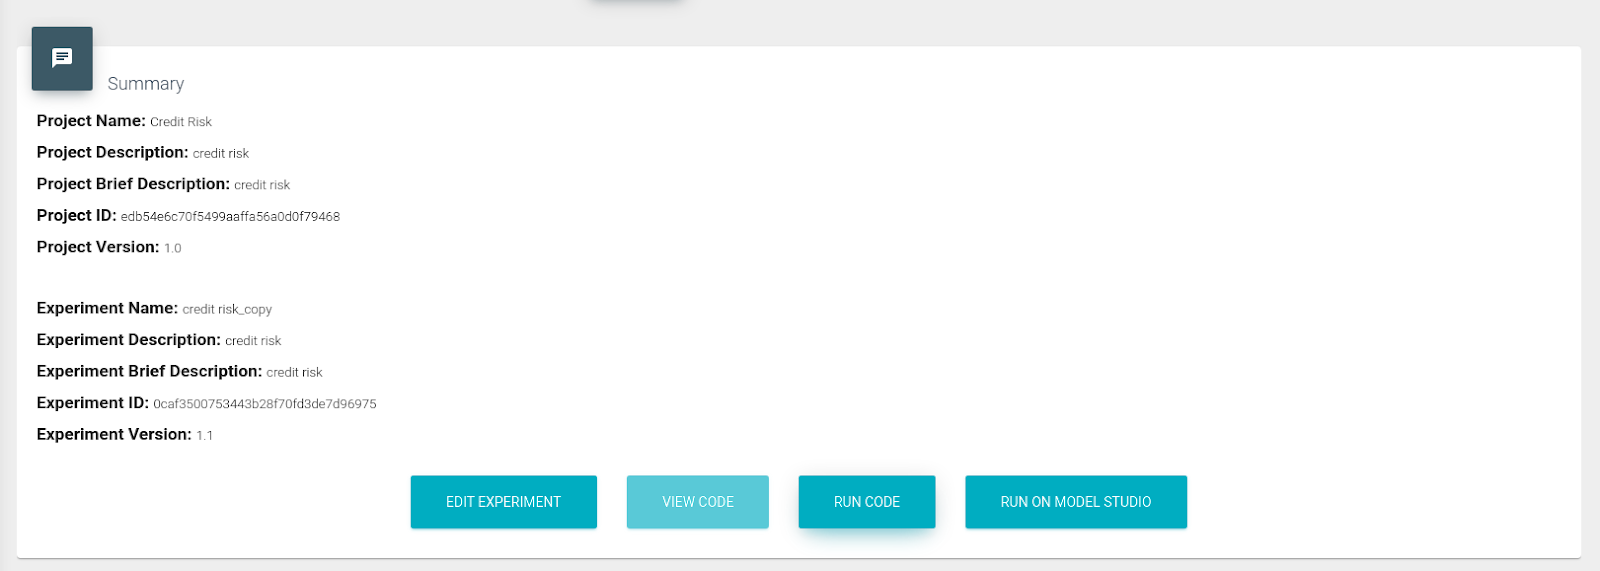
- In the summary board, you could view all the basic info about the experiment, like id and name. Here, you will be able to edit the basic information about the experiment, like the experiment configuration, name, etc. The view code button will show the code in gist format if it exists. The run code button will open an interactive environment in google colab with the code launched. The Run on Model Studio button will be able to use the experiment configuration, to automatically launch the resources and execute the experiment as a pipeline. For now, these functions just show some demo code. Contact info@qusandbox.com for a deeper discussion of how Model Studio executes the pipeline. The report subboard in the summary is different from others, which shows a table containing all the reports published to QuTrack related to this experiment. QuTrack is a ledger data storing application using QLDB and Ethereum to permanently store data. QuSandbox supports kinds of different reports, like notes reports, issues reports, audit reports, and score reports, and the details about each kind of report will be introduced in the later related chapters.
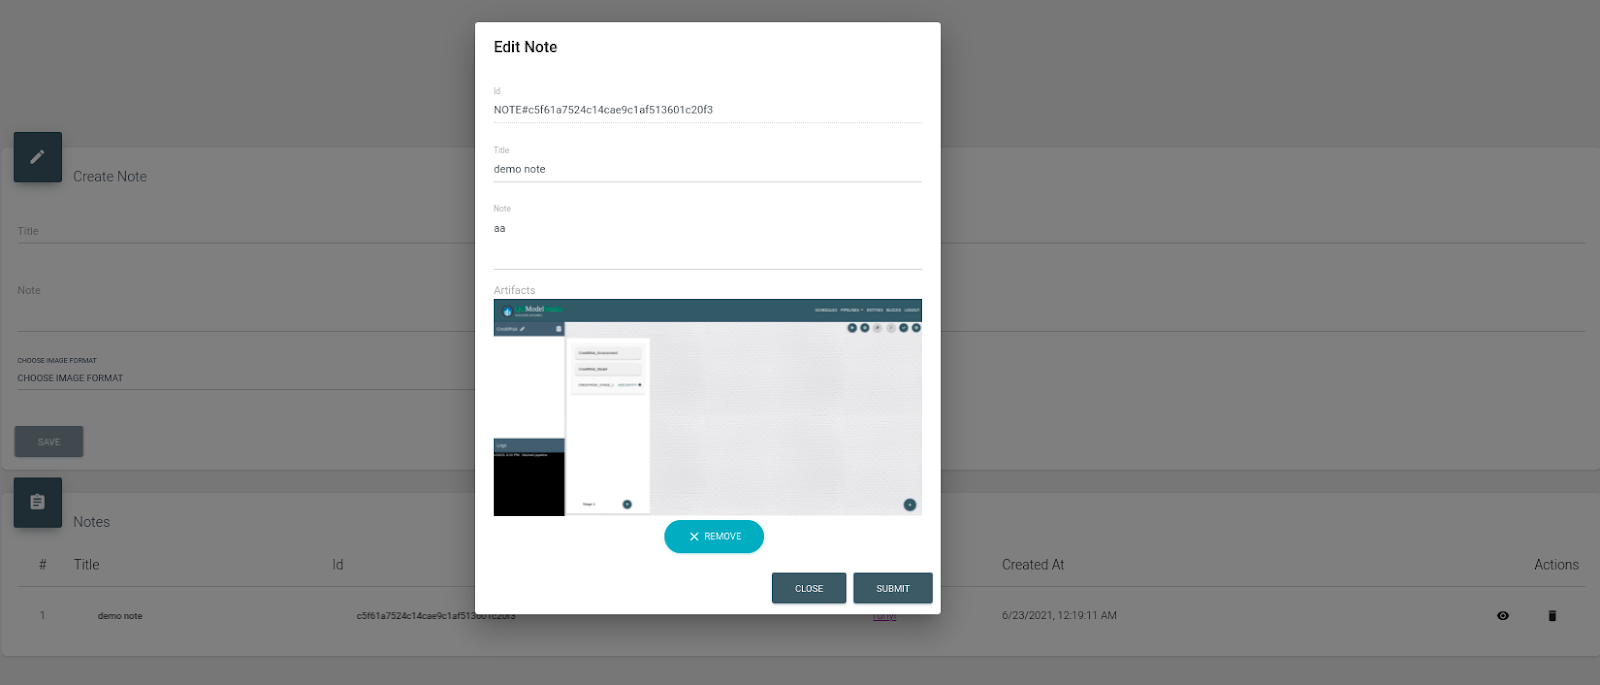
- In the notes subboard of each board, you could write notes for this board, and upload support materials in four formats. After inputting the materials, click save to save the notes. Below are the types of materials supported:
- Base64 requires a text format input of image links or images in base-64 format.
- Embed link requires a text format input of embeddable HTML code.
- Plotly JSON requires a text format input of Plotly format JSON that could generate Plotly charts in python.
- The platform also supports uploading images directly.
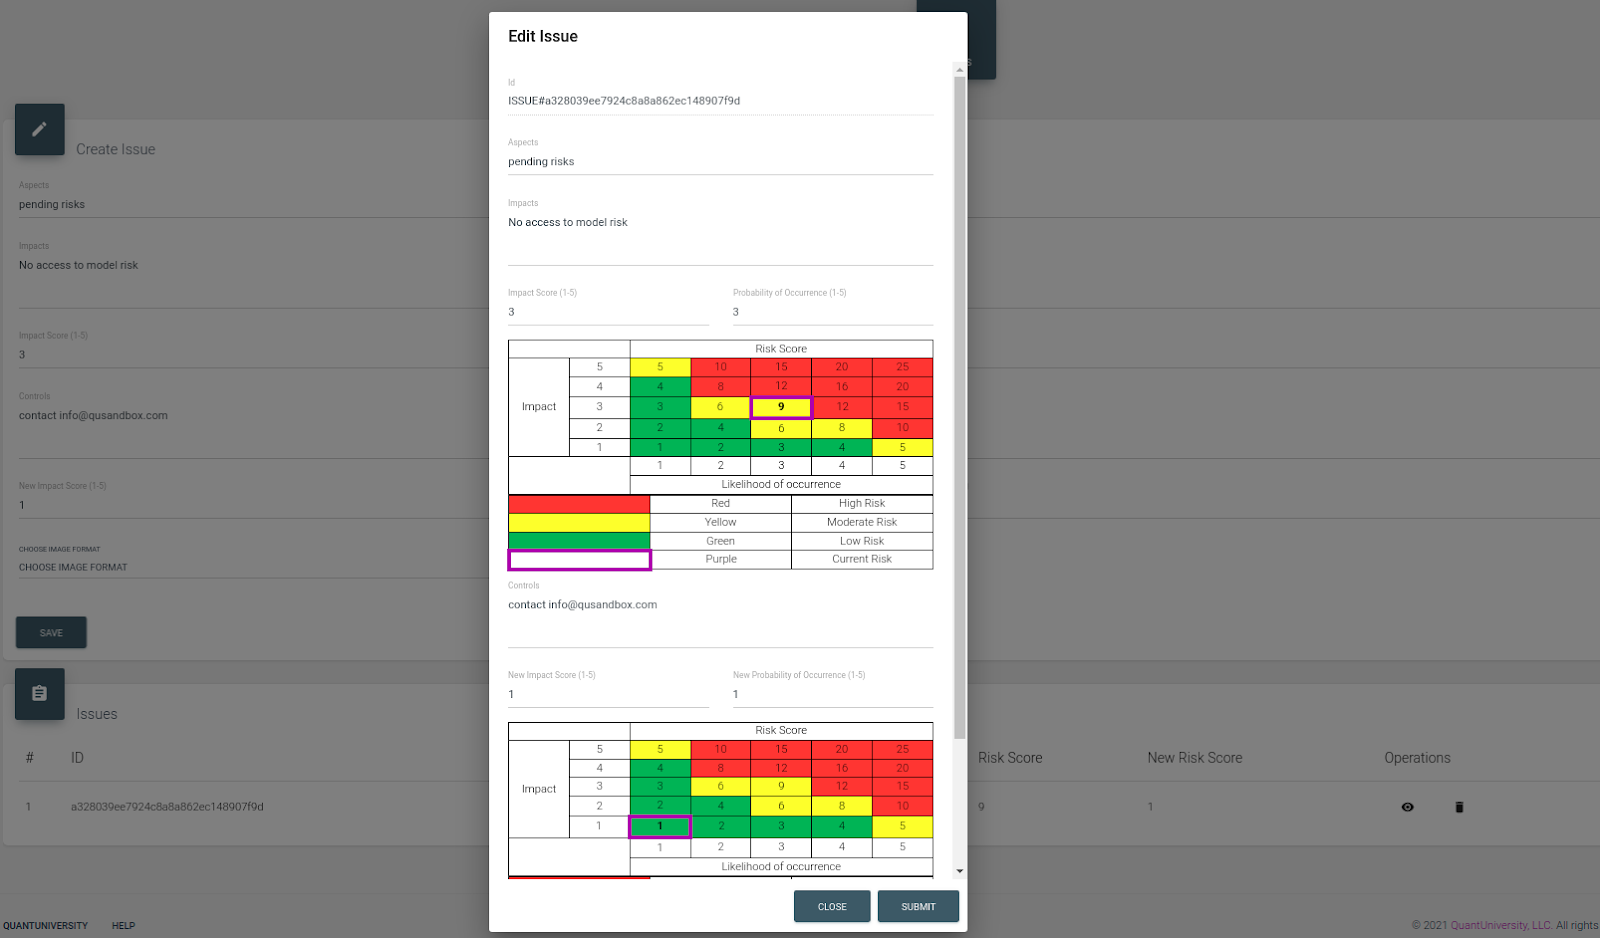
- In the issues subboard, you could write issues for this board. An issue is kind of a note adding a score describing the degree of the risk, which records both risk and after control score. As the screenshot shows, there is a table defining how serious the risk is.
- In the environment board, there is a DAG format chart explaining the pipeline defined by the experiment configuration in the pipeline sub board. The actual environment subboard is about how to use the Model Studio to fire up the experiment to generate the related data card, model card, etc. automatically, which is not open to the public for now, but you could view the data reports and model reports in the next two boards.
- For now, in the data board and model board, trial users could only view the data card and model card pre-generated by Model Studio. In addition, QuSandbox supports visualizing datasets using superset on demand, which is available in the credit risk project.
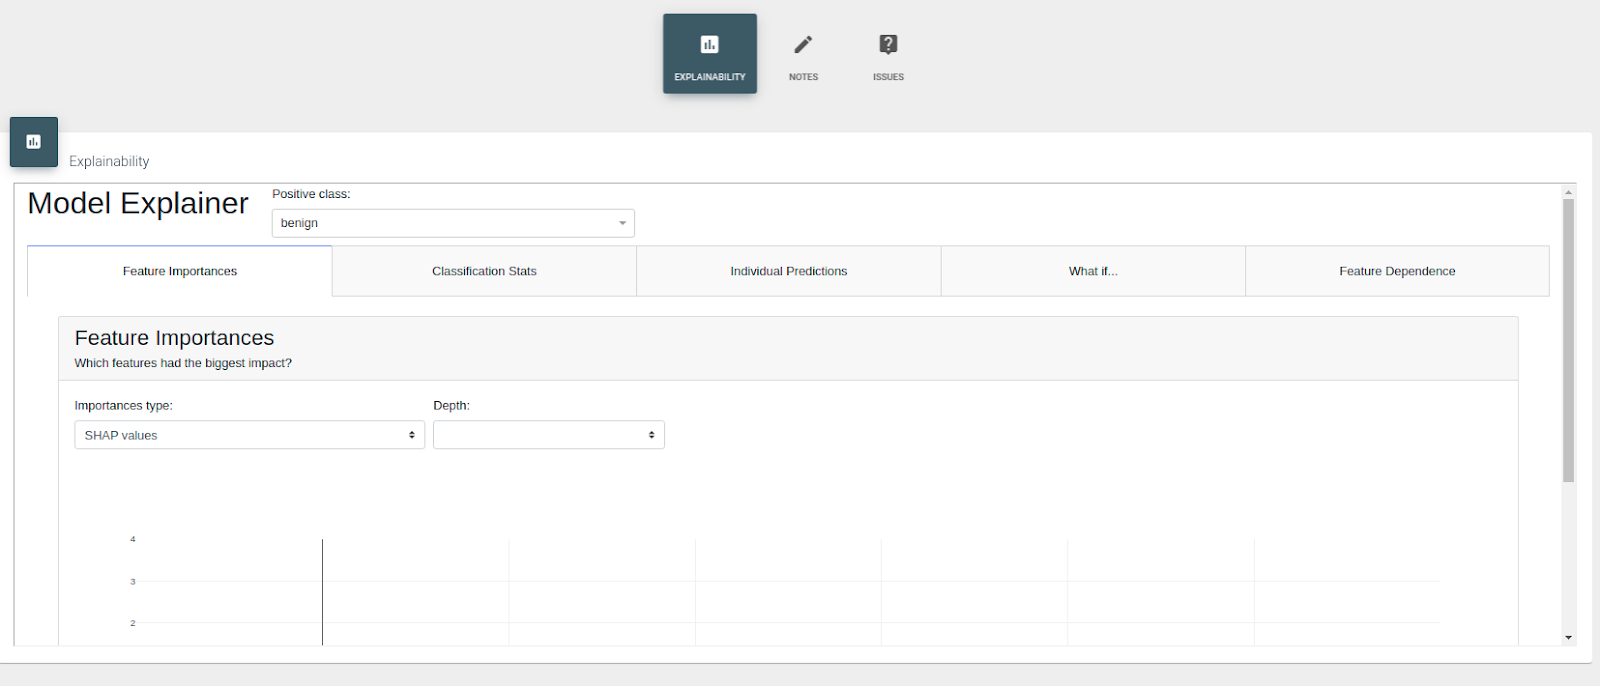
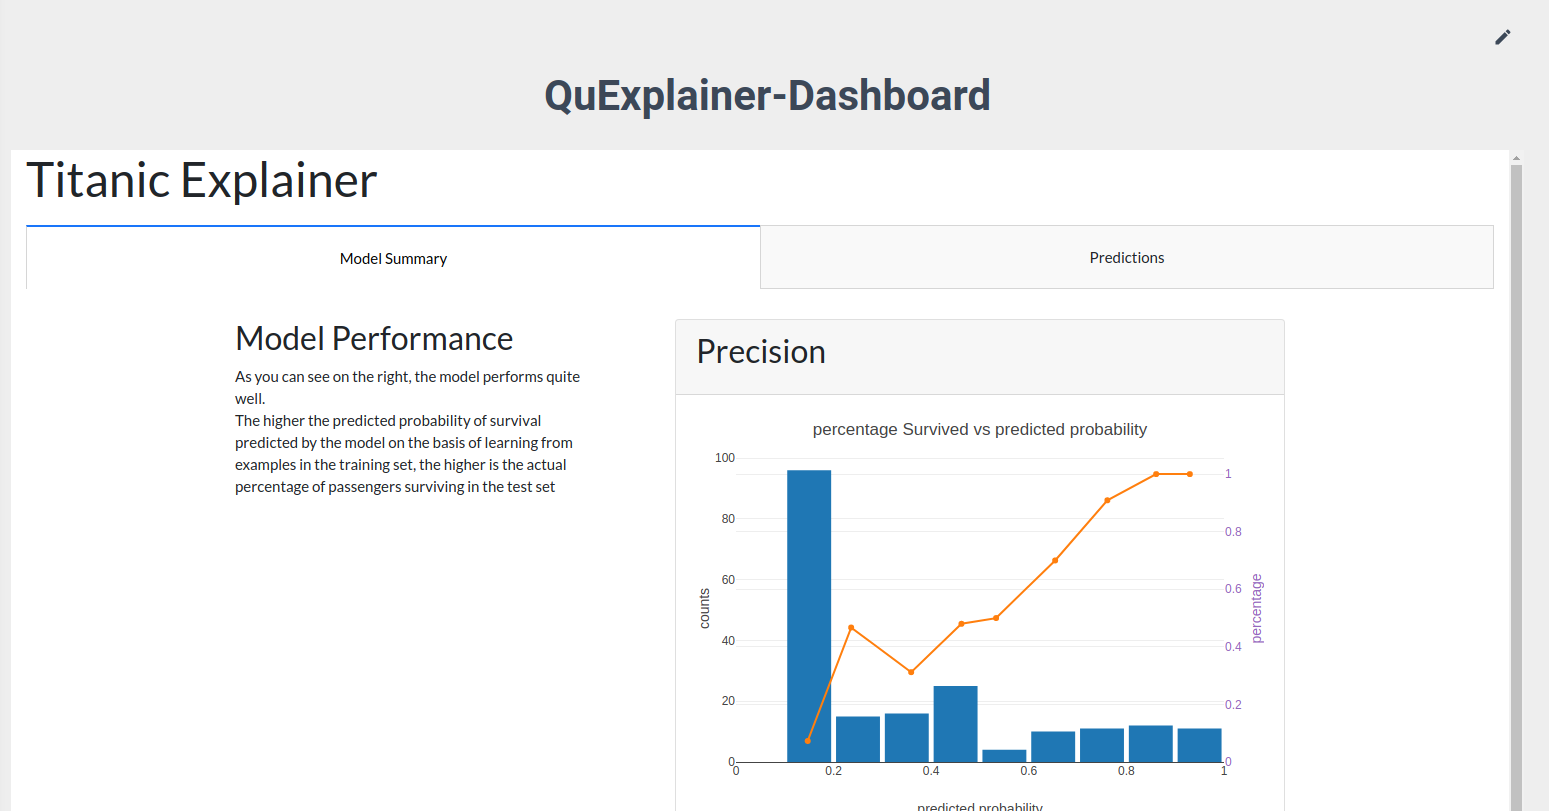
- The credit risk project does not have contents in the explainability dashboard, you could click the button to view the explainability service QuSandbox supports and view a demo explainability dashboard in the ML Sklearn breast cancer project.
- The fairness dashboard is still pending, only accepting creating notes and issues.
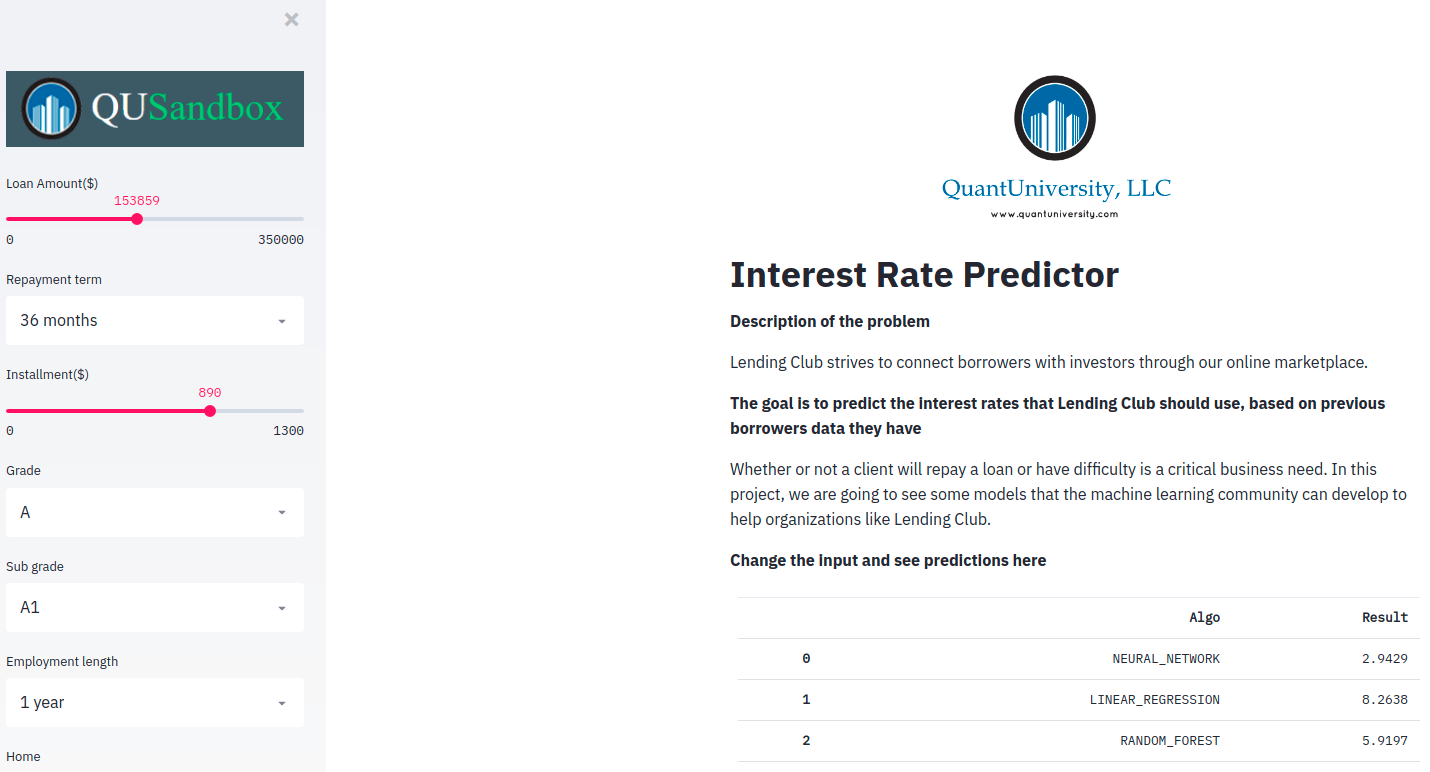
- In the Deployment board, you could have a try on the deployment of the model. After interacting with the UI or posting data to the API, you would get the result and the request would be recorded in the Grafana dashboard which is embedded in the Monitoring board. If nobody else trying the demo, you will see an empty Grafana inside the monitoring board
- All Test related cards are newly added, which only supports notes.
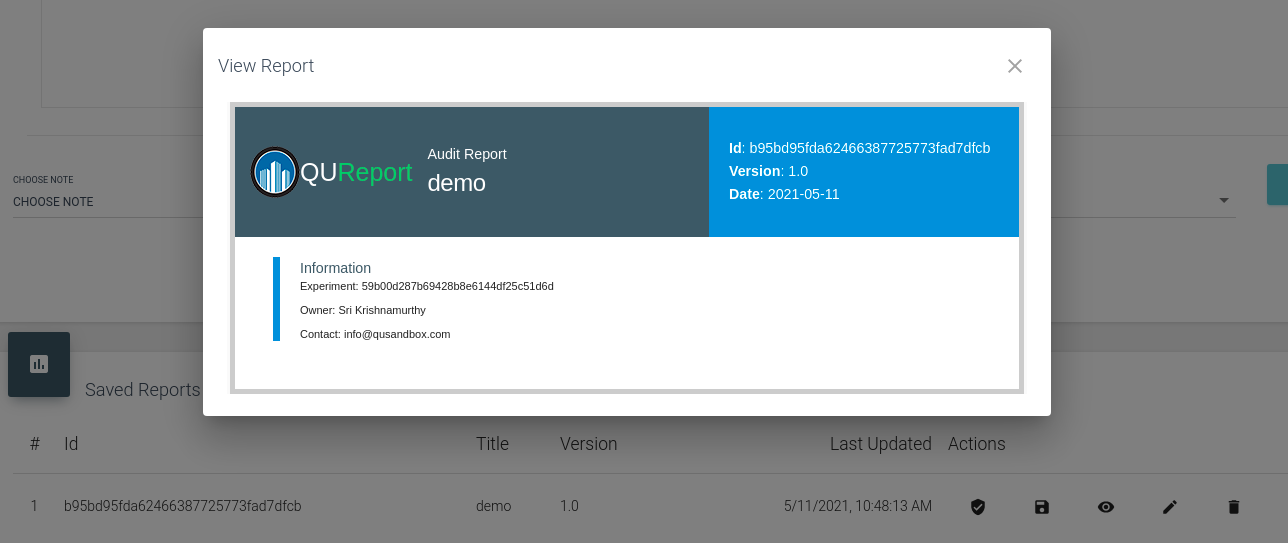
- In the Audit Checklist board, you could generate a single-page report, by the survey/form and selecting notes from the notes of the Audit Checklist as appendices. After selecting any notes, you need to click the add note button to actually save the note to the form. Then, you could view and edit your submitted report data in the following report management table, which supports viewing on QuTrack, publish to QuTrack, view, edit, delete. For reports published to QuTrack, you will be able to view them inside the QuTrack report browsing card under the summary card. Any first-level board could own its audit report subboard, but we only make it available as a separate audit checklist board for demo purposes. Reference of choices for saving the report:
- save the current form values only by selecting save only.
- save the form and generate the report by clicking generate the report.
- generate the report and save the md5 of the report into QuTrack(A blockchain-based application to help permanently store and share data) by selecting publish record on QuTrack
- save the report into QuTrack by selecting publish record and report on QuTrack.

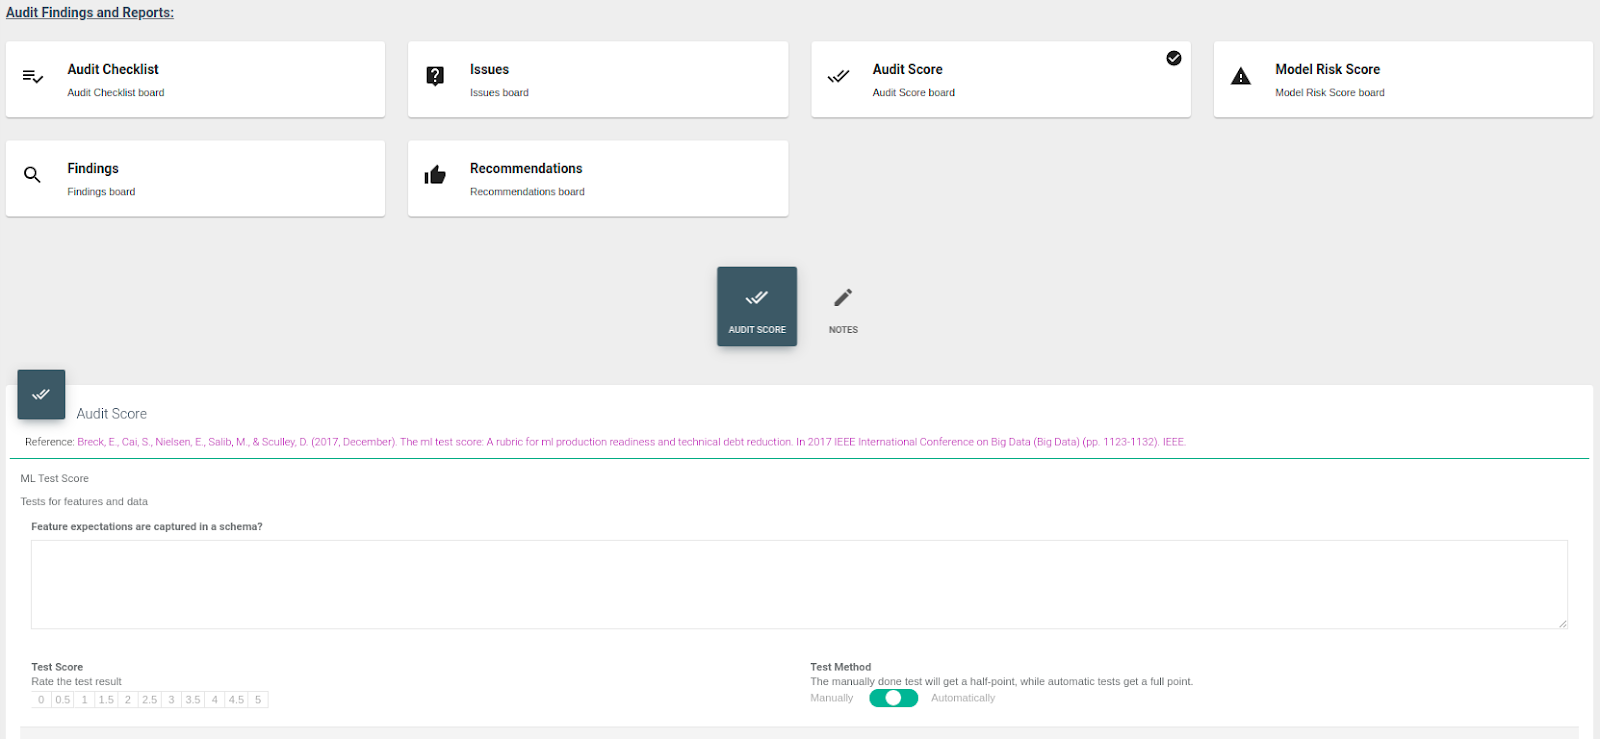
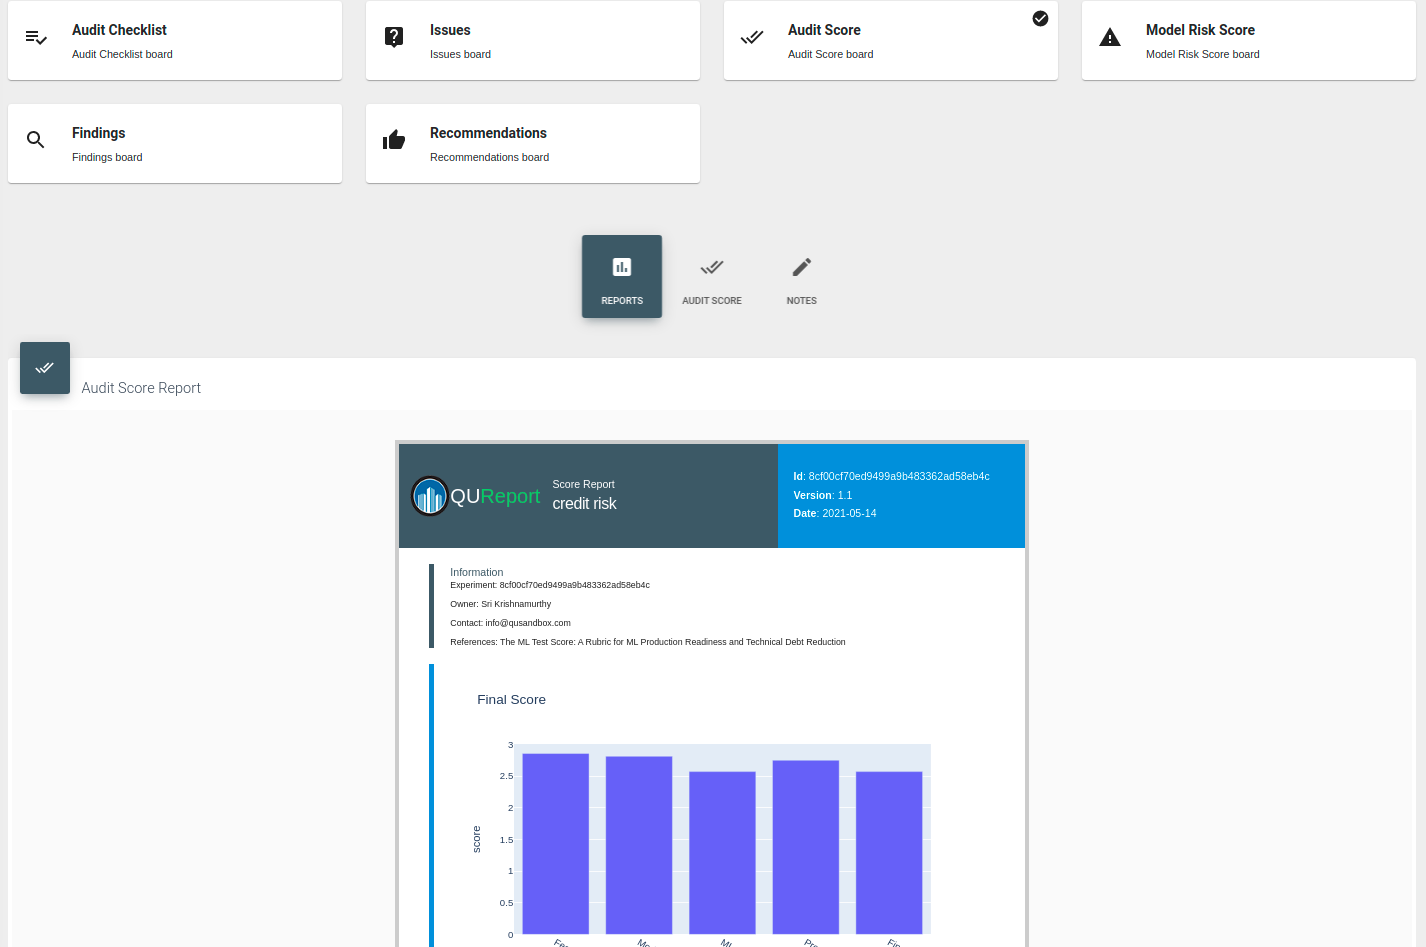
- In the Audi Score board, you could rate the performance by answering a series of problems associated with how to evaluate the model. The survey contains four parts and you could generate an analysis report with a calculated final score for the whole model and each aspect of the model. In this template, the final score will be calculated based on the minimum of each level. The Model Risk Score is another template with two levels of questions, which calculates the final score based on the weight of each question. Under the TUV experiment, we show three more templates, which calculate the final score based on average.
- The Findings and Recommendations currently only support adding notes.
Steps
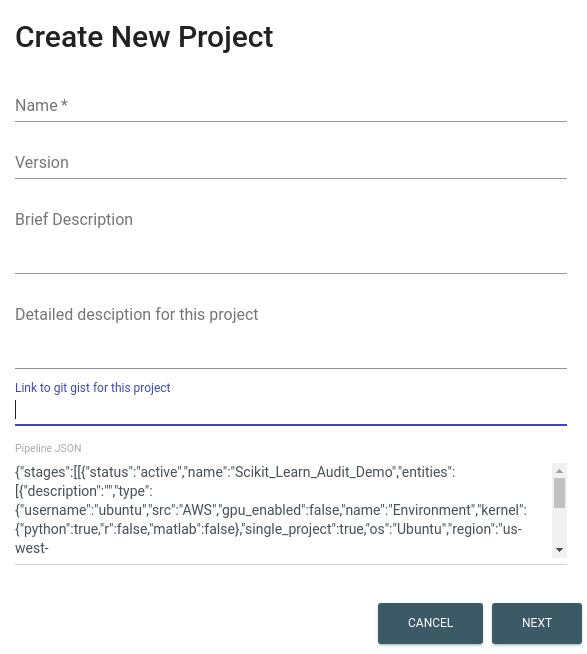
- Click the create project button on the QuProjects page, you will see a modal like this for inputting the basic info about the project. Name, version, and brief are the information that will be shown in the projects dashboard, while the description is shown inside the project. The gist is a git gist link showing scripts for firing up the project. The Pipeline JSON is the configuration file instructing QuSandbox on how to firing up the project(This JSON could be generated using Modelrisk, contacting info@qusandbox.com for more info about Modelrisk)
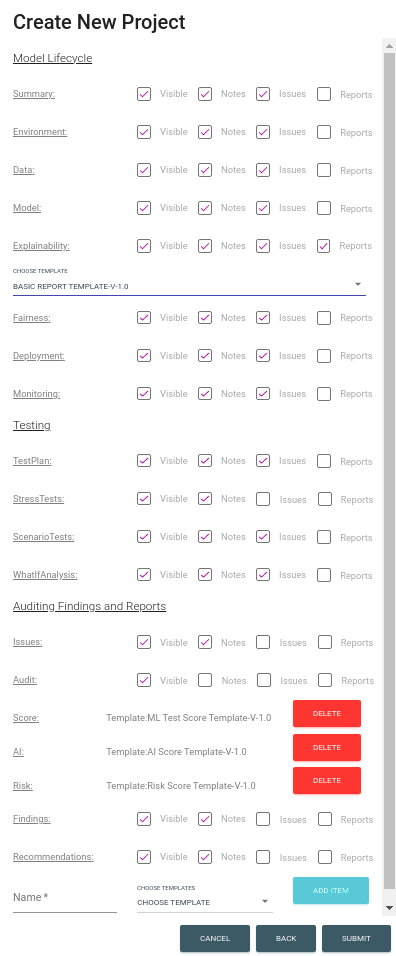
- After clicking the next button, you will see a page for defining the layout of the project. As mentioned above, an actual environment will be explained in three groups of boards, and the board has two types: predesigned board and standalone report board. In the current Qusandbox version, we assume that every project needs all predesigned boards, which will be changed to dynamic draggable dashboard support adding, editing, ordering, deleting in the future. For now, you could uncheck the visible button for the specific board to make it invisible, and uncheck notes and issues to delete the sub board from that board. You could also check the Reports and select a template to add a report subboard to the board. In the end, you could create a new standalone report card by inputting a unique name, selecting a template, and clicking the add item button, which is different from all other boards' names. In addition, you could click the delete button to delete any standalone report board. After finishing designing the project, you could click submit to create the project.
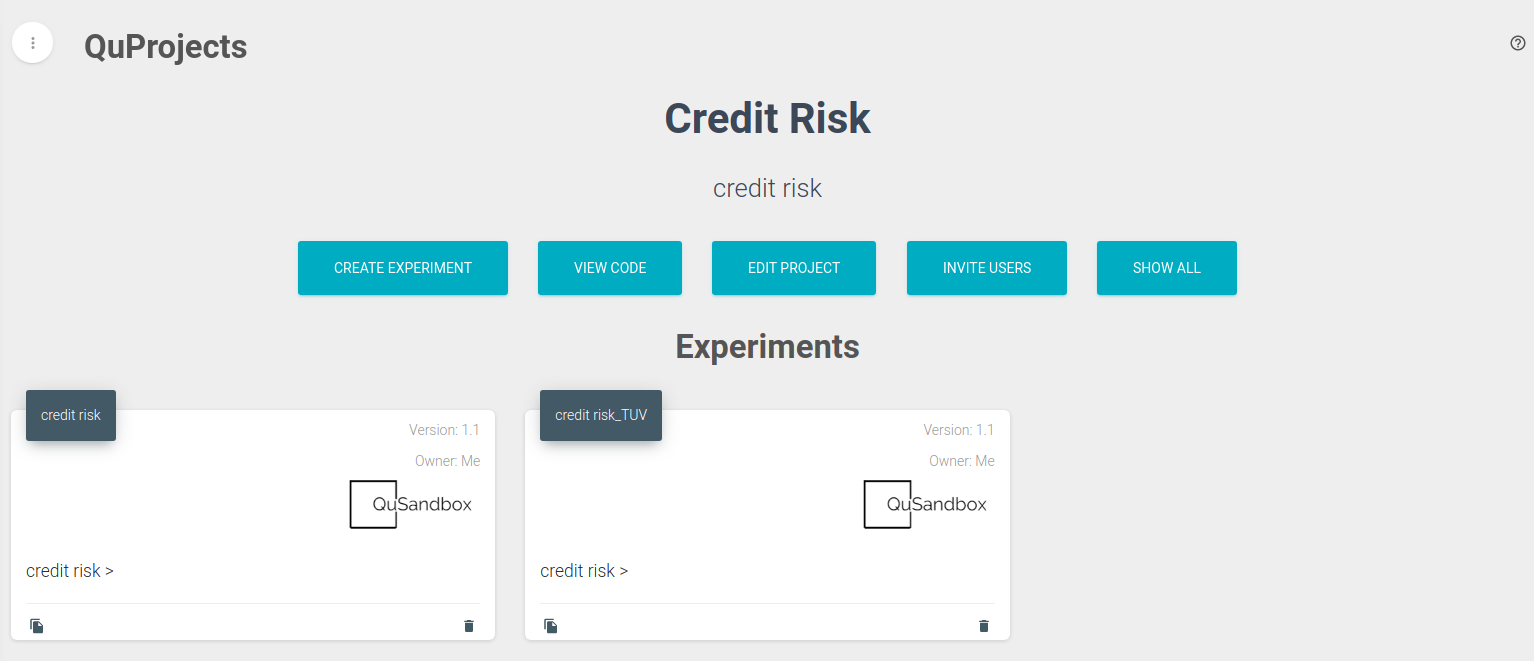
- After creating the project, you could click the created project and view the experiment dashboard of the specific project. Here you could create new experiments as mentioned above. The newly created experiment will auto load the layout defined in the project, but you could edit it later on-demand.
- As some functions are pending, there is some additional info required to fill up the experiment, which are Modelrisk pipeline JSON, explainability dashboard link, deployment link, and monitoring link. For now, all of these could be created by our teams manually on-demand, and please contact info@qusandbox.com for more information.
Reports Template Generation
In addition to a standalone report board, each card will have a checkbox for report. You can generate reports by using the templates inherited inside. We have already chosen the template for you, but once you want to create your own template. Firstly, click Report under the QuToolBox. Then follow the steps of the Browse Report Template listed below.
Steps
- Click the expand button nearing "QuToolBox" in the sidebar, you would be able to see a dashboard for all available tools supported by QuSandbox.
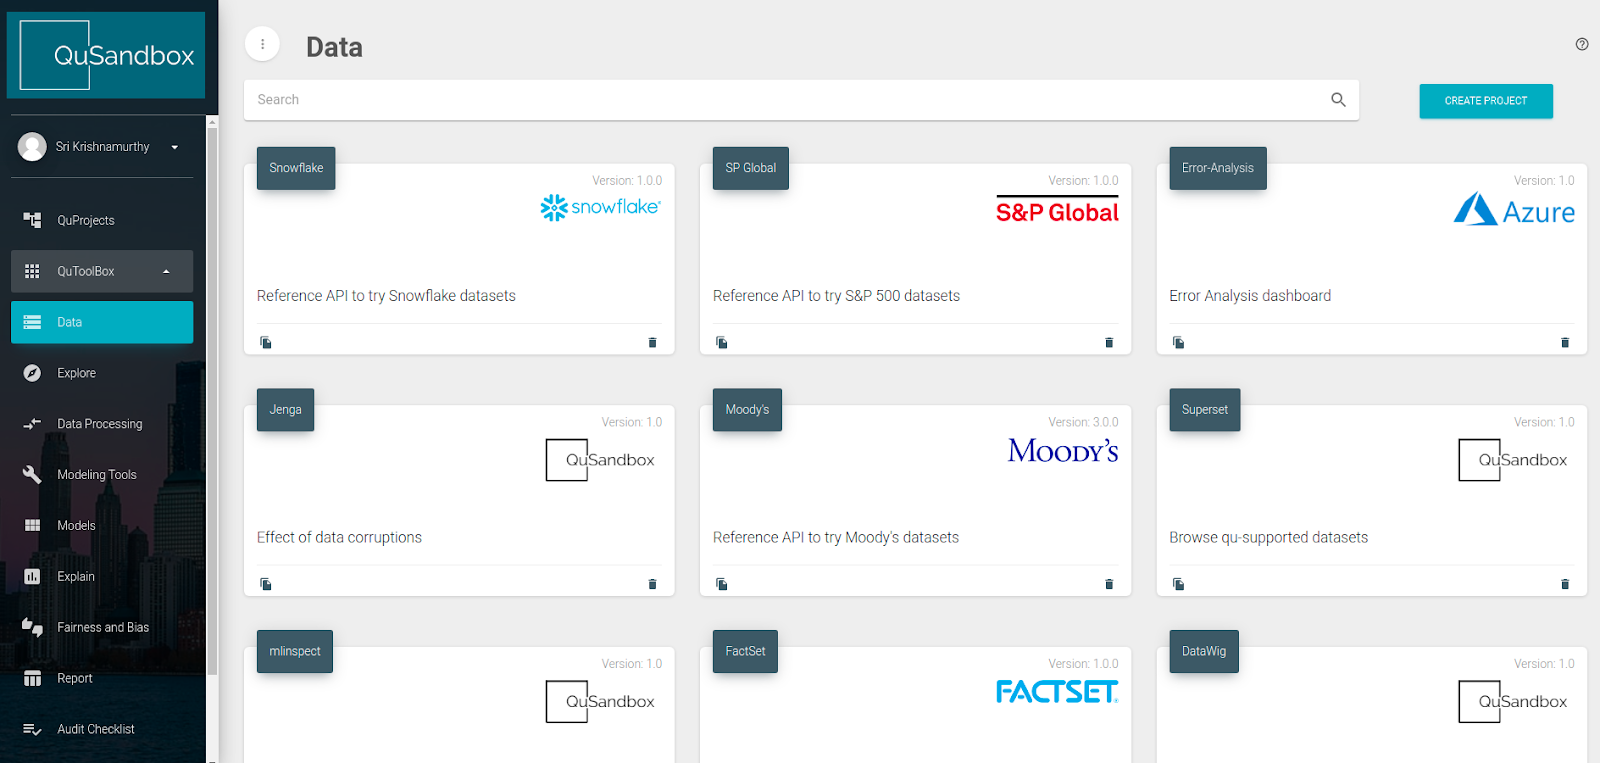
- Click the expand button, you could see a list of tools categories. Click any category will get a filtered dashboard of tools.

- Click any card, you would be able to browse the details of the tool.
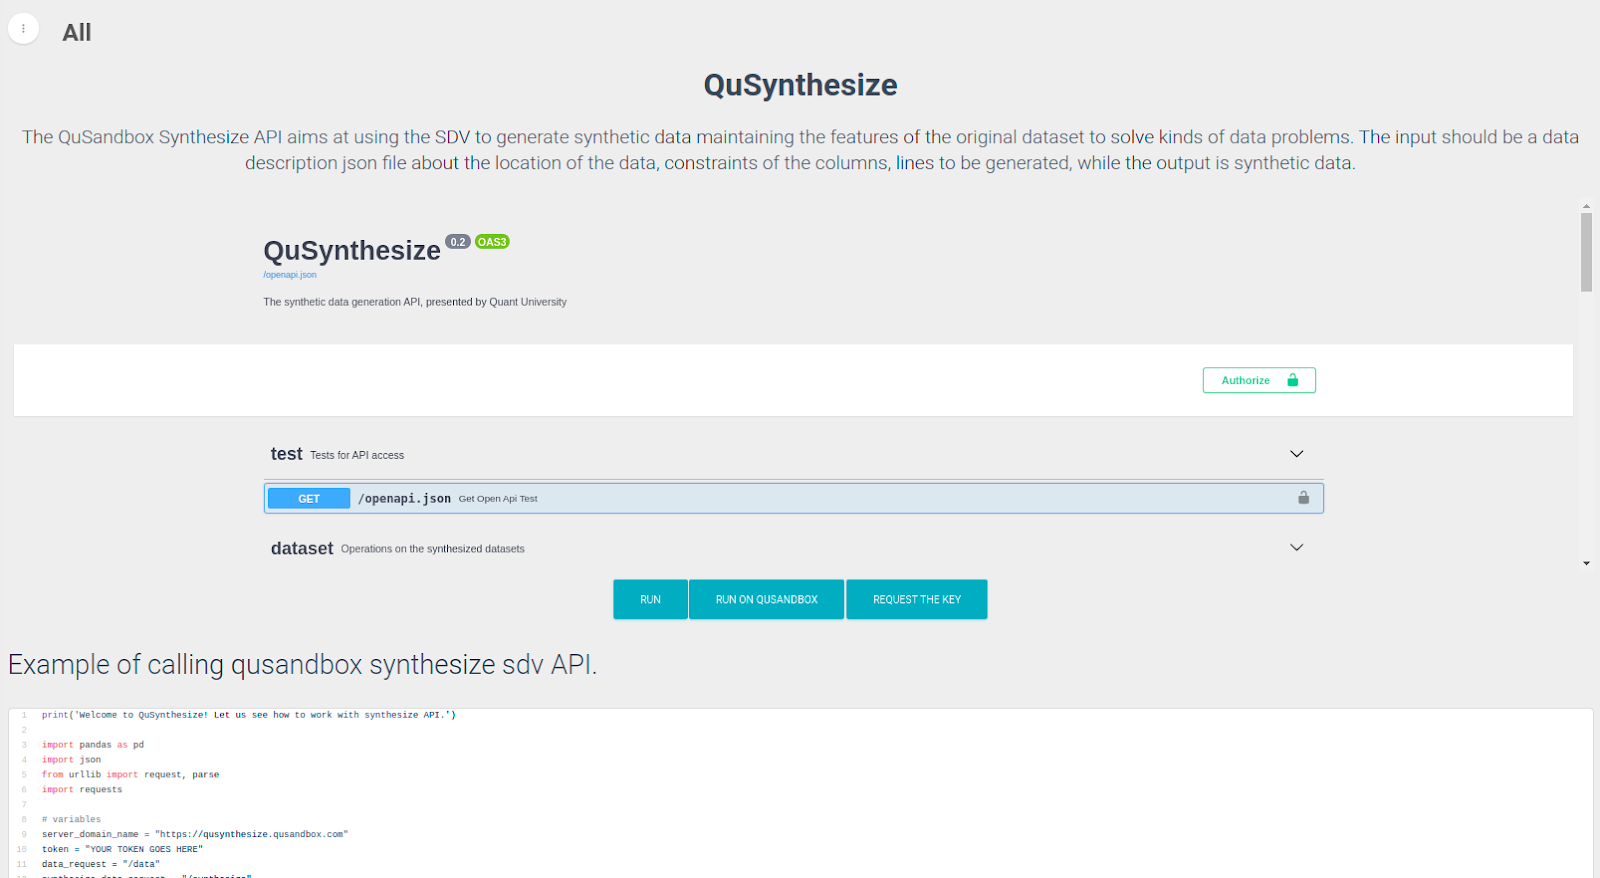
Tips
- The most complicated tools will contain name, version, description, interactive iframe, run the demo, run on QuSandbox, gist code, and request key.
- Name, version, and description are basic info about the tool. If the tool could be embedded into the page, there will be an interactive iframe that lets you be able to try the demo. If not, click the run button, you would be able to access the app in a new tab.
- Some tools that could be accessed by code would be accessible through gist code, google colab, or QuAcademy project. For gist code, you need to download the code and install the related packages; For google colab, you would need to have a google account; For the QuAcademy project, you would need to create a QuAcademy account to browse it.
- For some tools that would consume a lot of resources, there is a key protection mechanism. Currently, the key generation function is not open. If you are interested in trying these tools, please click the request key button, and email us your request details.
QuAudit is a tool for calling the report generation functions of QuSandbox by code. View the package on github.
Run on cloud
For quick access, you can click the buttons below to go through our tutorials in notebook format on Google Colab. For example, Sample Basic Report, Sample Score Report, Sample Report with Notes, Sample AIF360 Report
Run it locally
Just install the package using pip
# Install via pip
pip install git+https://github.com/qu-user-2/QUAudit.git
Import the package
from qu_audit.qu_audit import *Load the template. For more templates, browse on package's github, package's document page, or QuSandbox directly.
# browse the sample template
template_id = "7acd5c69079946b199c8bab692512f27"
MyTemplateReader = TemplateReader(template_id)
MyTemplateReader.load()
Get sample input of the selected template, then edit it to get the input for your own report.
# get sample input to edit
sample_input = MyTemplateReader.get_sample_input()
# Edit the sample input
sample_input.set_value('Environment', 'My first try of QuAudit locally')
Then generate the report using the sample input generated above.
MyReportGenerator = ReportGenerator(name="My first try of QuAudit", version="1.0")
MyReportGenerator.load(sample_input)
html = MyReportGenerator.generate()
If you are using a jupyter notebook environment, you can use our helper function to view the report. If you run all the code as a python script, you could save the report somewhere and open it in the browser.
# show report in notebook
show_report(html)
# save the report to file
MyReportGenerator.save()
Advanced Functions
Besides the basic report generation function, the QuAudit package also supports other high level functionalities:
- Score report: Input number values / metrics and visualize it as charts in the generated report.
- Notes: Put customized support materials in the report by input them as notes.
- Browse templates: Browse all template data in json format through code.
- Customized Report: Generate report without using any templates, or create your own templates and generate reports in a unique format.
- Interact with QuSandbox: Publish reports to QuSandbox to properly manage the whole auditing process.
For more specific introductions, please visit the package documentation directly.
API Reference
For more specific API reference of the package, please visit the package documentation directly.
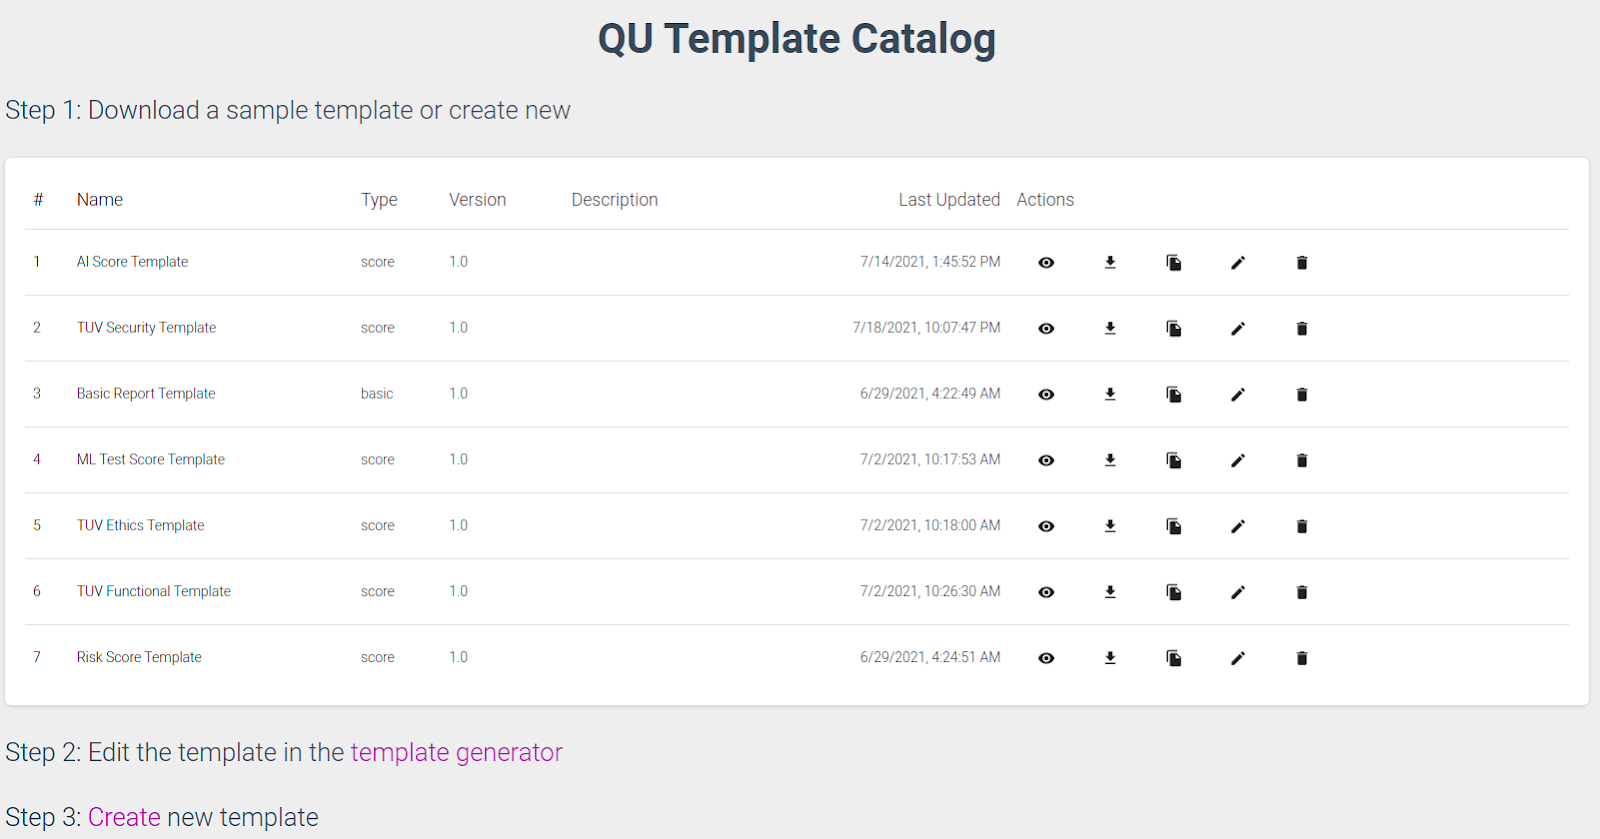
There is a tool called QU Template Catalog inside the report category of QuToolBox, In here you could view and create templates that could be used in the auditing process using survey.js.
How to create your own report template
- Though you could create your own template from scratch using survey.js, starting from existing templates would be a better choice, as we need to follow some naming rules(at the end of this block) to let the QuSandbox backend understand the template. In the first step, you will see a table of all sample templates, and you can view, download, copy each template. For now, deleting and editing only work for admin, but you can create as many templates as you want. Because the template is configured in JSON format, you can select one template that is most similar to what you want, then click the copy button to copy it. After this, you should have the corresponding configured template in JSON format.
- After copying the sample template you want, you can open the survey creator page by clicking the link in the second step. Then, you can paste the template JSON in the JSON Editor tab and edit the template by UI or modifying the JSON directly. Read survey.js documentation to understand how to edit survey.js.

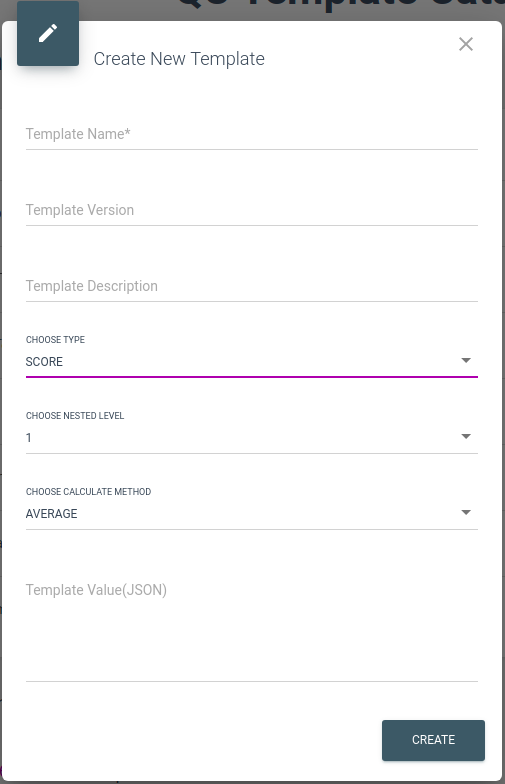
- After editing the templates, you should copy the JSON value from the JSON Editor tag and go back to the QuSandbox page. Then, you should click the create template button in Step 3, and input the information needed for creating the templates. The specification is explained in the next paragraph.
Specification
- The template name is a required value to identify the template, while the version is a value supposed to be defined with a default value of 1.0. The template name and version consist of a unique identifier of a specific template, which means you could not find two templates with the same name and version at the same time. The description is just some additional text information helping define the use case of the template.
- Then, you need to define the type of template. Currently, QuSandbox only supports two kinds of templates. The basic template will read each input as text input and print all inputs in order, requiring no rules to follow. When choosing the score template, you will need to follow the name rules and define the layout of the templates to help the QuSandbox backend correctly understand the templates. In the end, you should paste the template JSON copied from the template editor.
- Based on the template layout, the naming convention of the template is different. The key point here is symbols ‘_' and ‘#' are reserved for QuSandbox that means they have special meanings and should be only used at specific positions not as normal text, which will be explained below. In addition, the final name of each question should be unique, as survey.js will generate the view of repeat questions with the same value. Nested level 1 means that each page of the report will have no subpage, all questions will be displayed at the top level, which also means there must be 0 or 1 ‘_' symbol in the name of the questions. For page-level text questions, you should name them as <page name>#brief. For the actual questions, you should name them as <page name>_<question name>#brief for text questions, and <page name>_<question name>#score for rate questions. Nested level 2 means that each page of the report will have subpages, all questions will be displayed on the subpage level, which means there could be 0, 1, or 2 ‘_' symbols in the questions name. For subpage-level text questions, you should name them as <page name>_<subpage name>#brief. For the actual questions, you should name them as <page name>_<subpage name>_<question name>#brief for text questions, and <page name>_<subpage name>_<question name>#score for rate questions. Then, you could change the calculate method, the default option is average, which will calculate the average of all #score questions. When choosing weight questions, you are supposed to provide <page name>_<subpage name>#score and <page name>_<subpage name>_<question name>#score to instruct the weight of the question. Without providing weight, Qusandbox will keep calculating it as average.
Report Generation
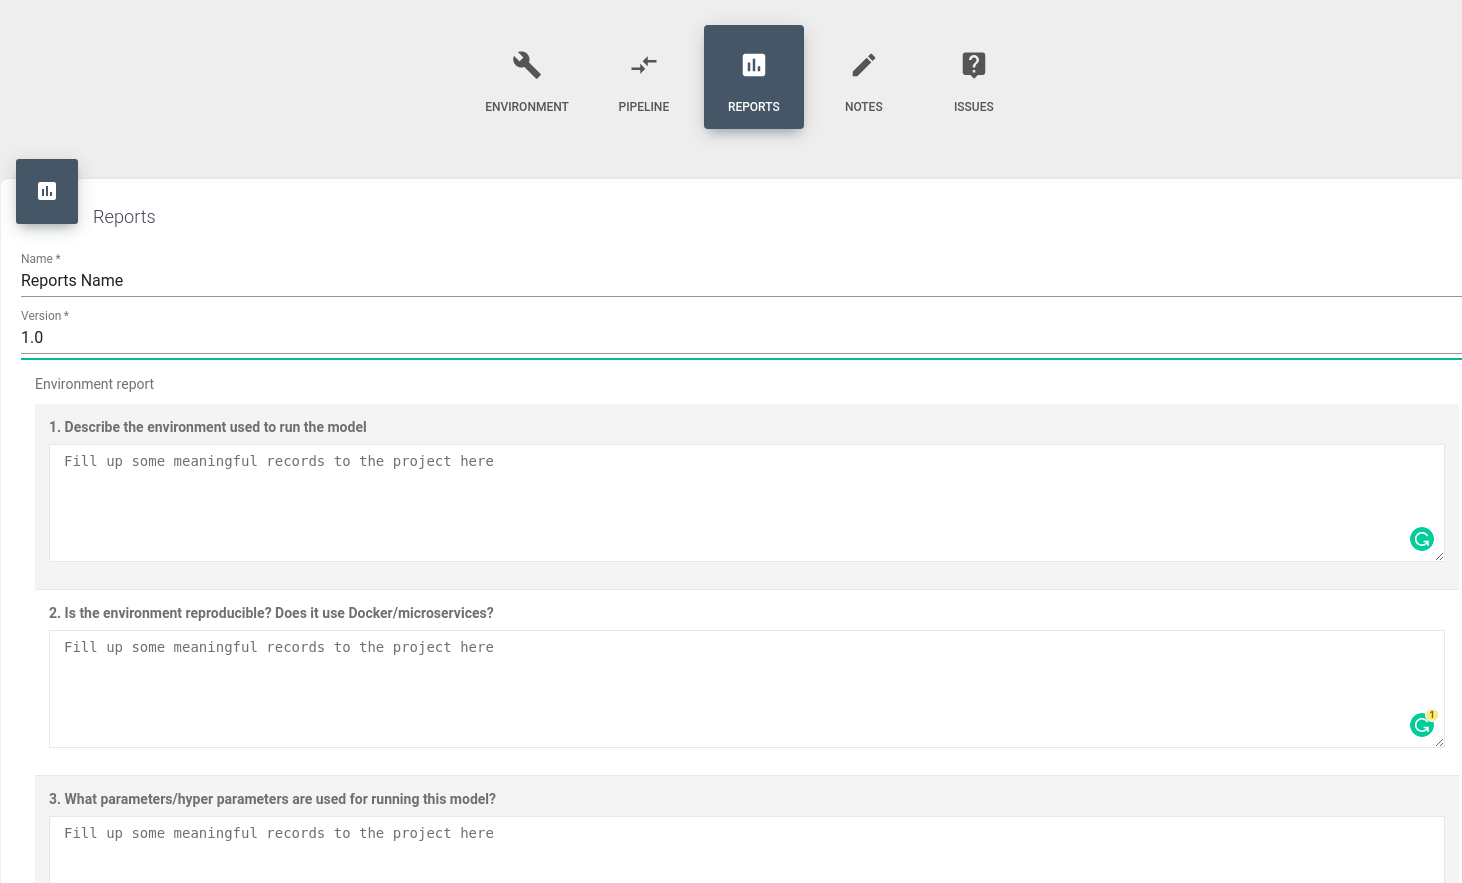
Inside every functional card, you can see there is a REPORTS option. You can generate the corresponding report using the template we have already given or you can use your self-defined template to generate the report. The template example is shown below. You can put any keyword or you can put nothing if you like below.
Notice:
There is an ADD NOTE button on the bottom of the REPORTS. You can not add the note without creating it in advance. If you are trying to add a note, please click the NOTES option beside the REPORTS first, then create a note. You should find the note you just created under the CHOOSE NOTE and then add the note to your report.

There are four options that will show up once you click the SUBMIT button.
- Save Only -- This option will not generate a new report but save the current report information instead.
- Generate Report -- This option will generate a report below.
- Publish record on QuTrack -- This option will publish the record to QuTrack without the report.
- Publish record and report on QuTrack -- The option will publish the report to QuTrack with the report
